Hints will display for most wrong answers; explanations for most right answers. You can attempt a question multiple times; it will only be scored correct if you get it right the first time. To see five new questions, reload the page.
I used the official objectives and sample test to construct these questions, but cannot promise that they accurately reflect what’s on the real test. Some of the sample questions were more convoluted than I could bear to write. See terms of use. See the MTEL Practice Test main page to view questions on a particular topic or to download paper practice tests.
MTEL General Curriculum Mathematics Practice
Question 1 |
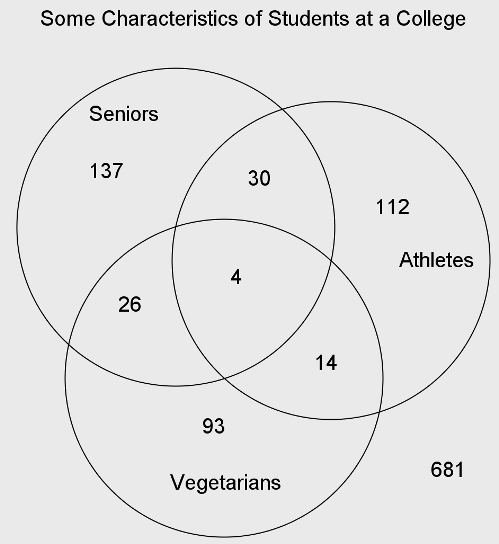
The Venn Diagram below gives data on the number of seniors, athletes, and vegetarians in the student body at a college:

How many students at the college are seniors who are not vegetarians?
\( \large 137\) Hint: Doesn't include the senior athletes who are not vegetarians. | |
\( \large 167\) | |
\( \large 197\) Hint: That's all seniors, including vegetarians. | |
\( \large 279\) Hint: Includes all athletes who are not vegetarians, some of whom are not seniors. |
Question 2 |
A car is traveling at 60 miles per hour. Which of the expressions below could be used to compute how many feet the car travels in 1 second? Note that 1 mile = 5,280 feet.
\( \large 60\dfrac{\text{miles}}{\text{hour}}\cdot 5280\dfrac{\text{feet}}{\text{mile}}\cdot 60\dfrac{\text{minutes}}{\text{hour}}\cdot 60\dfrac{\text{seconds}}{\text{minute}}
\) Hint: This answer is not in feet/second. | |
\( \large 60\dfrac{\text{miles}}{\text{hour}}\cdot 5280\dfrac{\text{feet}}{\text{mile}}\cdot \dfrac{1}{60}\dfrac{\text{hour}}{\text{minutes}}\cdot \dfrac{1}{60}\dfrac{\text{minute}}{\text{seconds}}
\) Hint: This is the only choice where the answer is in feet per second and the unit conversions are correct. | |
\( \large 60\dfrac{\text{miles}}{\text{hour}}\cdot \dfrac{1}{5280}\dfrac{\text{foot}}{\text{miles}}\cdot 60\dfrac{\text{hours}}{\text{minute}}\cdot \dfrac{1}{60}\dfrac{\text{minute}}{\text{seconds}}\) Hint: Are there really 60 hours in a minute? | |
\( \large 60\dfrac{\text{miles}}{\text{hour}}\cdot \dfrac{1}{5280}\dfrac{\text{mile}}{\text{feet}}\cdot 60\dfrac{\text{minutes}}{\text{hour}}\cdot \dfrac{1}{60}\dfrac{\text{minute}}{\text{seconds}}\) Hint: This answer is not in feet/second. |
Question 3 |
Which of the following is an irrational number?
\( \large \sqrt[3]{8}\) Hint: This answer is the cube root of 8. Since 2 x 2 x 2 =8, this is equal to 2, which is rational because 2 = 2/1. | |
\( \large \sqrt{8}\) Hint: It is not trivial to prove that this is irrational, but you can get this answer by eliminating the other choices. | |
\( \large \dfrac{1}{8}\) Hint: 1/8 is the RATIO of two integers, so it is rational. | |
\( \large -8\) Hint: Negative integers are also rational, -8 = -8/1, a ratio of integers. |
Question 4 |
The least common multiple of 60 and N is 1260. Which of the following could be the prime factorization of N?
\( \large2\cdot 5\cdot 7\) Hint: 1260 is divisible by 9 and 60 is not, so N must be divisible by 9 for 1260 to be the LCM. | |
\( \large{{2}^{3}}\cdot {{3}^{2}}\cdot 5 \cdot 7\) Hint: 1260 is not divisible by 8, so it isn't a multiple of this N. | |
\( \large3 \cdot 5 \cdot 7\) Hint: 1260 is divisible by 9 and 60 is not, so N must be divisible by 9 for 1260 to be the LCM. | |
\( \large{{3}^{2}}\cdot 5\cdot 7\) Hint: \(1260=2^2 \cdot 3^2 \cdot 5 \cdot 7\) and \(60=2^2 \cdot 3 \cdot 5\). In order for 1260 to be the LCM, N has to be a multiple of \(3^2\) and of 7 (because 60 is not a multiple of either of these). N also cannot introduce a factor that would require the LCM to be larger (as in choice b). |
Question 5 |
Below is a portion of a number line:

Point B is halfway between two tick marks. What number is represented by Point B?
\( \large 0.645\) Hint: That point is marked on the line, to the right. | |
\( \large 0.6421\) Hint: That point is to the left of point B. | |
\( \large 0.6422\) Hint: That point is to the left of point B. | |
\( \large 0.6425\) |
If you found a mistake or have comments on a particular question, please contact me (please copy and paste at least part of the question into the form, as the numbers change depending on how quizzes are displayed). General comments can be left here.